Sources: The World Bank and author’s calculation
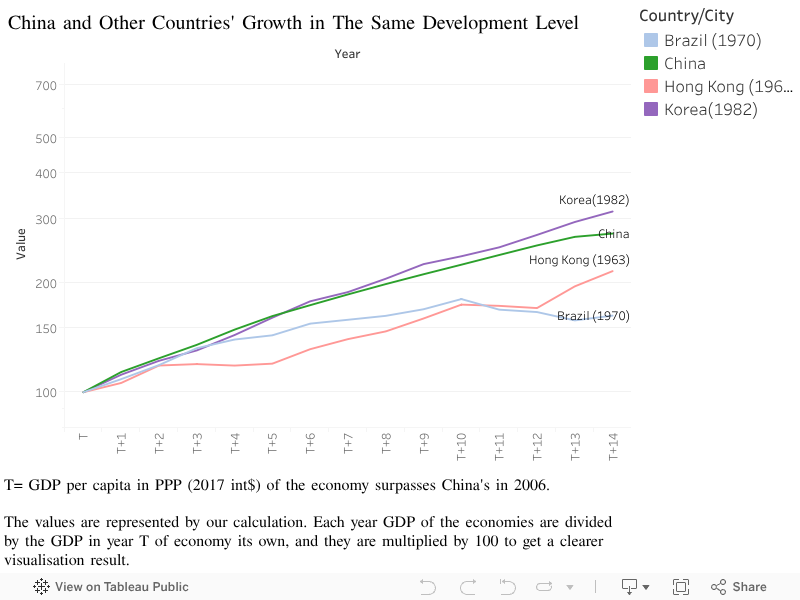
The line graphs compare the economic growths of China and other countries or cities, including Brazil, Hong Kong, Japan, Korea, and Singapore.
For the upper graph, we compared China’s GDP to other cities. However, we found that due to the later development of China, the comparable data is limited. We can only compare China to the other three cities’ GDP in 14 years.
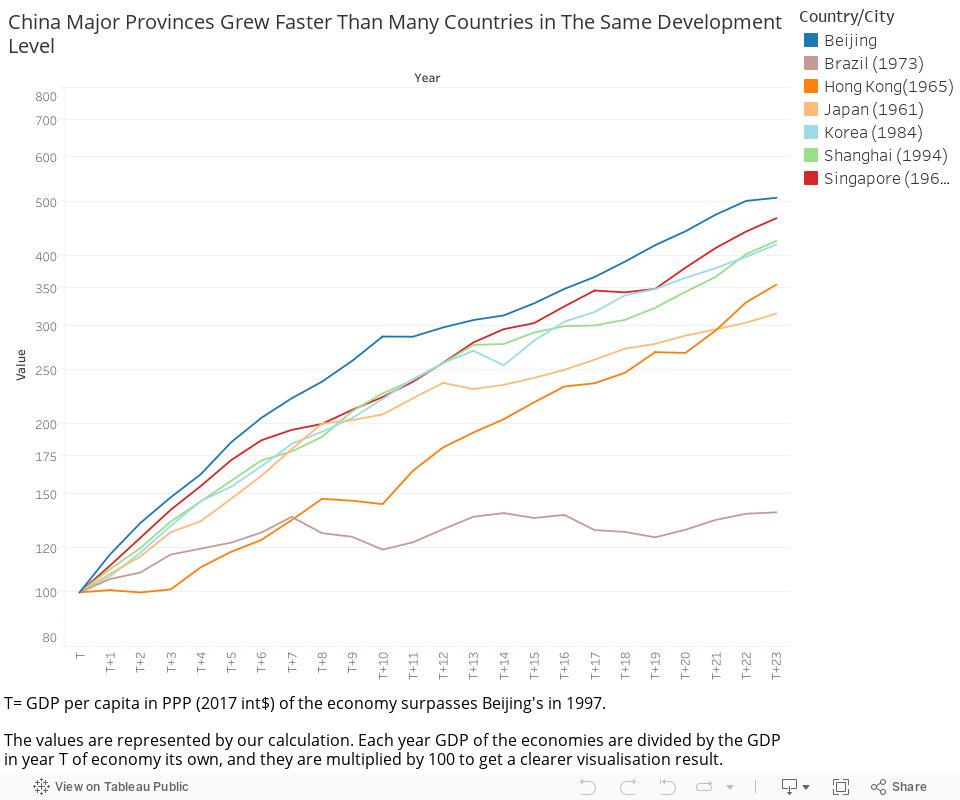
To extend the comparability, we invited two rapid-growing Chinese provinces, Beijing and Shanghai, to compare their PPP over the GDP per capita of other economies, obtaining the lower graph.
In the second graph, the Year T is when the GDP per capita of each economy surpassed Beijing’s 1997 GDP per capita (i.e., 7,356 in 2017 PPP int $).
The growths of Beijing and Shanghai were similar to other competitors in Southeast Asia, like Singapore and Korea. The burst of growth in Beijing and Shanghai is even more remarkable than in Hong Kong and Japan compared with the same growing period.